Satellite Modelling
Starlink and OneWeb Clusters Modelled
Back in the summer of 2022, I worked for Dr. Aaron Boley on some material that eventually became one of the foci of the soon to be formed Outer Space Institute. Specifically, I was studying debris cascades.
The concept is fairly intuitive; say you have a collection of satellites orbiting the Earth at 1000km in altitude and one of them blows up. Well, now you have a large collection of debris orbiting the Earth at various altitudes (clustered around 1000km), all of which is traveling fast enough to damage or destroy satellites on contact. With the speeds of orbit, even a fleck of dried paint can be deadly. These collisions then create more debris, which creates more collisions, which creates more debris, and so on. The debris also has its orbit degrade over time (atmospheric air resistance is still present), so this giant mass of debris starts descending down in altitude and causing havoc along the way.
There’s a lot of ways to model this scenario. Since the computational cost of them tends to be quite high, most of my time was spent developing a model that was as fast as possible while still providing some insights. I won’t pontificate about it here, look at the documents above (or the repositories on that section of the website) if you’re interested in all the gritty details, but I will show a typical result.

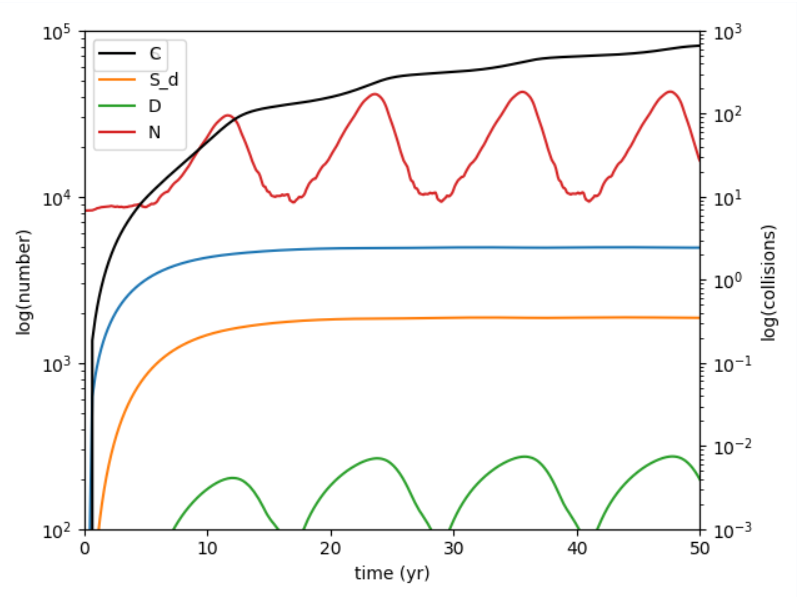
In this plot, we assume that the satellite cluster is maintained by launching 1000 satellites per year, and that these satellites have an active lifetime of 2 years, after which they are de-orbited and safely burned up in the atmosphere. The black line is the cumulative number of collisions between debris and satellites, the red line the total amount of debris pieces in orbit, the blue line the active satellites in orbit, the yellow line the satellites deorbited, and the green line the satellites disabled by collisions with debris.
A quick note since I assume you’re curious, the cyclic behaviour seen in that graph arises from the solar cycle, which causes the atmospheric density around Earth to change cyclically along with it.